

How to Monitor Resources on a VPS: A Comprehensive Guide
In today’s digital era, managing a Virtual Private Server (VPS) efficiently is crucial for ensuring optimal performance and resource allocation. Whether you’re running a small blog or a large-scale web application, understanding how to effectively monitor your VPS resources can make a substantial difference in reliability and speed. This article will provide a detailed guide on monitoring resources on a VPS, with tips and tools to help you keep your server running smoothly.
Understanding VPS Resources
Before diving into the monitoring tools and techniques, it’s important to understand what VPS resources are. A VPS is essentially a virtual server that functions independently, hosted on a physical server. Resources typically include CPU, RAM, disk space, and network bandwidth. Proper management and monitoring of these resources can prevent overloads, save costs, and ensure your applications run efficiently.
Key Tools for VPS Resource Monitoring
Several tools and software can help you monitor your VPS resources. Here’s a list of some of the most effective ones:
- htop
- Overview: htop is an interactive process viewer for Unix systems, providing a real-time view of the system’s resource usage.
- Features: Displays CPU, memory, swap, and more; allows sorting of processes by criteria
- Installation:
sudo apt-get install htopfor Debian/Ubuntu systems
- vnStat
- Overview: vnStat is a network traffic monitor that keeps a log of your daily data usage and provides detailed reports.
- Features: Monitors multiple interfaces, creates long-term bandwidth statistics.
- Installation:
sudo apt-get install vnstatfor Debian/Ubuntu systems
- Nagios
- Overview: Nagios is an open-source monitoring tool that checks system resources and services.
- Features: Real-time monitoring, alerting, reporting
- Installation: Follow the official documentation for extensive setup instructions
- Zabbix
- Overview: Zabbix is another comprehensive monitoring solution for networks and applications.
- Features: Offers scalability, real-time monitoring, flexible threshold definitions.
- Installation: Accessible through Zabbix’s official installation guide
- Prometheus and Grafana
- Overview: Prometheus is a leading open-source monitoring tool, often used in combination with Grafana for graphical representation.
- Features: Multi-dimensional data model, time series database, powerful query language
- Installation: Complex setup; refer to the Prometheus and Grafana installation guides
Understanding Resource Metrics
To effectively monitor your VPS, you need to understand the key metrics you’ll be dealing with:
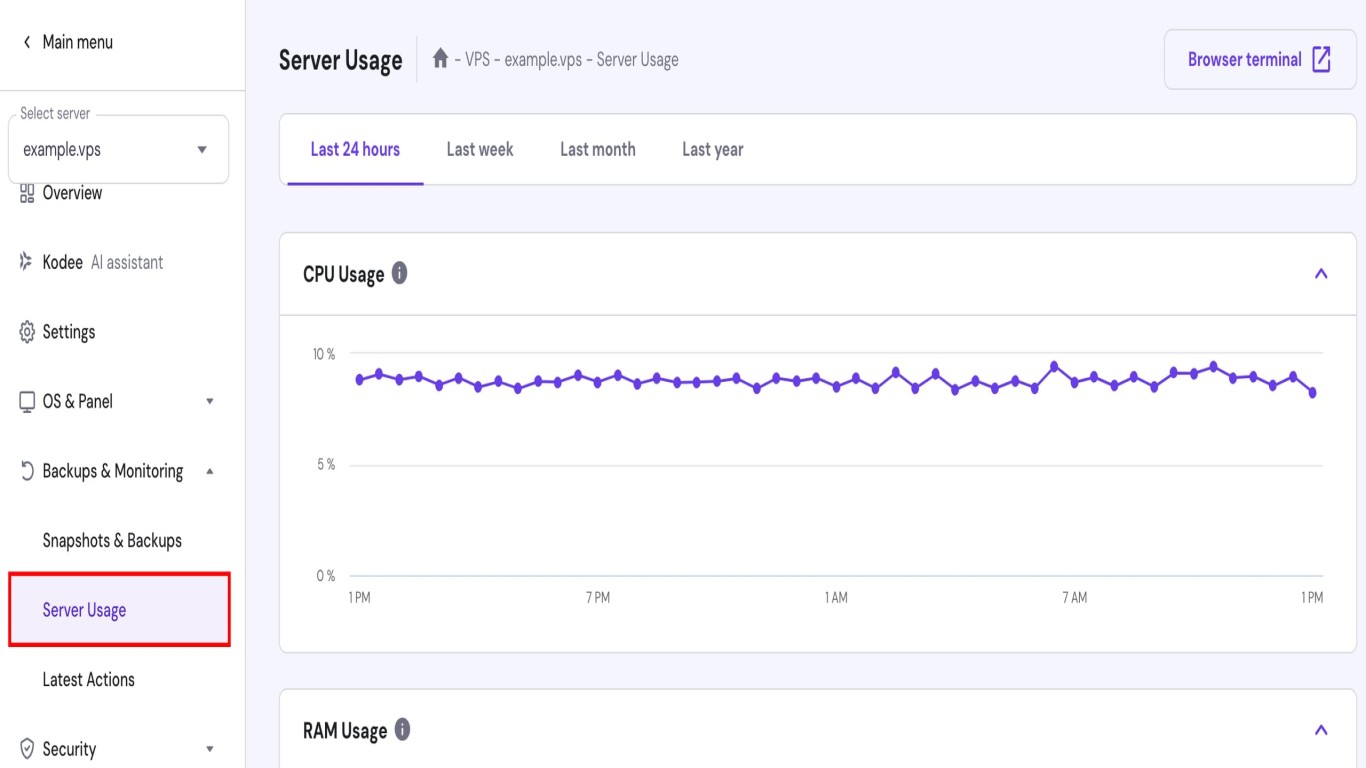
CPU Usage: Represents the percentage of processing power being utilized. High CPU usage may indicate that your VPS is overworked and requires optimization or scaling.
Memory Usage (RAM): Shows how much memory is being used by processes. High RAM usage could cause slower performance as the server may start using swap memory, which is slower.
Disk Usage: Indicates how much storage space is used. Running out of disk space can cause errors and data loss.
Network Bandwidth: Represents the amount of data sent and received over the network. Monitoring bandwidth helps avoid bottlenecks and ensures smooth data flow.
Steps to Monitor Your VPS Resources
- Install Monitoring Tools:
- Choose the tools that best fit your needs from the list above.
- Follow their installation instructions to get them running on your VPS.
- Set Up Monitoring Dashboards:
- Use tools like Grafana to visualize data in dashboards.
- Set alerts for critical values that may indicate problems.
- Analyze Data Regularly:
- Consistently check your monitoring dashboards.
- Look for unusual spikes or trends that may need attention.
- Optimize and Scale:
- If particular resources are consistently over-utilized, consider optimization processes like caching.
- For consistently high demands, scale up your VPS resources.
- Keep Software Updated:
- Regularly update your monitoring tools to benefit from the latest features and security patches.
Comparison of Monitoring Tools
When deciding which monitoring tool to use, consider these aspects:
- Ease of Use: Tools like htop offer straightforward usage, while Prometheus requires a steeper learning curve.
- Visualization: Grafana offers excellent visualization, whereas Nagios focuses more on alerts and notifications.
- Scalability: Both Zabbix and Prometheus are good for large infrastructures but might be overkill for smaller setups.
Conclusion
Monitoring your VPS is an integral part of maintaining server health and performance. By understanding key resources and using the right tools, you can ensure that your server runs efficiently, scales effectively, and serves your needs with minimal downtime. Remember, consistent monitoring coupled with proactive management is key to a robust and reliable VPS environment.
FAQs
- Why is monitoring VPS resources important?
- Monitoring ensures your server runs efficiently, prevents overloads, and reduces downtime, leading to better performance and user experience.
- What happens if my VPS resources run out?
- Running out of CPU, RAM, or disk space can cause server crashes, slow performance, and potential data loss.
- Can I automate VPS monitoring?
- Yes, many tools like Nagios enable automated alerts and reports to keep track of server resources without manual checks.
- Is it necessary to use more than one monitoring tool?
- Depending on your needs, combining tools can offer comprehensive insights, such as using vnStat for bandwidth and Prometheus for overall system health.
- How often should I check my VPS resource usage?
- Regularly, depending on your server’s usage. Daily checks are ideal to quickly catch and resolve any issues.
Start implementing these strategies and tools today to ensure your VPS continues to operate seamlessly and efficiently!